

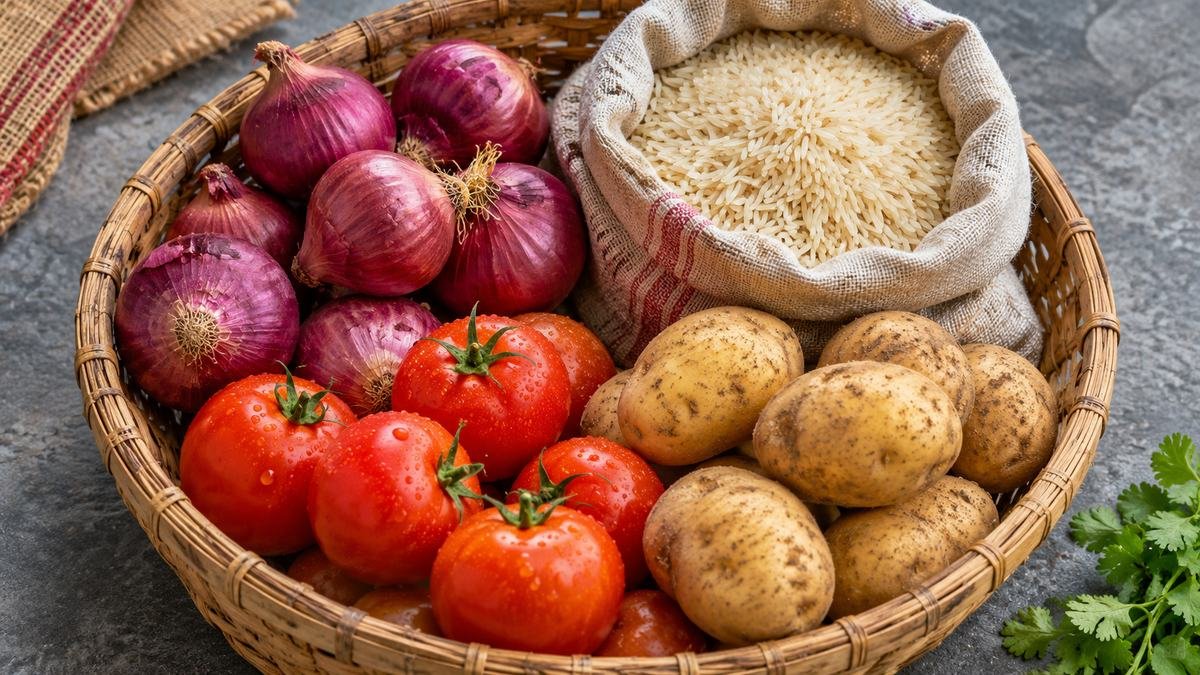
Onions averaged ₹51.69 per kg in India in the Department of Consumer Affairs retail report for 15 November 2026, the latest figures available for this 16 November update. Tomatoes averaged ₹36.31 per kg and potatoes ₹22.38 per kg. Rice fell from ₹49.42 to ₹48.64 per kg compared with the previous week. The main change in this set was in rice, with the three vegetable averages moving by less than 10 paise per kg over the week. See the Department of Consumer Affairs retail price report.
Onion, tomato, potato and rice prices this week
The figures below are all-India average retail prices per kilogram. The comparison uses the reporting dates of 15 November and 8 November 2026.
| Grocery item | 15 November | 8 November | Weekly change per kg |
|---|---|---|---|
| Onion | ₹51.69 | ₹51.78 | −₹0.09 |
| Tomato | ₹36.31 | ₹36.25 | +₹0.06 |
| Potato | ₹22.38 | ₹22.47 | −₹0.09 |
| Rice | ₹48.64 | ₹49.42 | −₹0.78 |
| Wheat | ₹32.91 | ₹33.20 | −₹0.29 |
| Wheat atta | ₹38.36 | ₹38.57 | −₹0.21 |
| Gram dal | ₹94.63 | ₹94.40 | +₹0.23 |
An average gives you a reference for how prices moved across reporting markets. At a shop, check the variety, weight and quality as well as the number on the display. A branded bag of rice and loose rice can have different prices even when both appear on a grocery list under the same name.
What changed over the past month?
Some kitchen staples were cheaper than a week earlier and still cost more than they did on 15 October. The department’s figures put rice at ₹47.48 per kg a month earlier, wheat at ₹32.06, atta at ₹37.75 and gram dal at ₹91.70. Against those October readings, the 15 November rates were higher by ₹1.16 per kg for rice, ₹0.85 for wheat, ₹0.61 for atta and ₹2.93 for gram dal.
The date you choose matters. A weekly comparison helps with the next market trip, while the monthly comparison shows how the cost of familiar staples has shifted since the middle of October. For items you buy in bulk, multiply the difference by the pack size. The ₹1.16 monthly rise in the benchmark rice price adds ₹5.80 to a five-kilogram purchase at those reference prices.
What a small grocery basket would cost
Take a household buying 5 kg of rice, 2 kg of onions, 2 kg of tomatoes and 3 kg of potatoes. At the 15 November national averages, that illustrative basket works out to ₹486.34. At the 8 November averages, the same basket would cost ₹490.57, a difference of ₹4.23.
| Item and quantity | Cost using 15 November averages |
|---|---|
| Rice, 5 kg | ₹243.20 |
| Onions, 2 kg | ₹103.38 |
| Tomatoes, 2 kg | ₹72.62 |
| Potatoes, 3 kg | ₹67.14 |
| Example basket total | ₹486.34 |
Rice accounts for ₹3.90 of the week-on-week reduction in that example. Your basket can move differently if you buy less rice or pay a higher local price for another item. To make the comparison useful, replace the sample quantities with what you normally buy each week.
Why the national average can differ from your market
The Price Monitoring Division collects retail and wholesale rates from reporting centres across India. Local market arrivals, produce grade, pack size and the type of seller can influence the price you see. Check the official reporting date if you are comparing the government figure with a retailer’s listing. A shop’s live rate and the department’s latest published average are collected for different purposes. Read how the department monitors essential food prices.
If you use an online grocery app, include the delivery or handling charge when comparing your total. Work out the cost per kilogram first. A ₹28 price for a 500 g pack works out to ₹56 per kg. That puts it on the same basis as a one-kilogram quote at a local store.
Which table should a household use?
Select retail for a comparison with the amounts you pay at a grocery shop. The department also reports wholesale prices, which relate to trade at a different point in the supply chain and may use larger units. If you switch from an all-India average to a reporting centre or region, compare that centre or region across both dates. Pairing a national figure one week with a single city the next mixes a change in location with a change over time.
If you also track staples like cooking oil, record the variety and unit used on the label. Compare a one-litre pack with the per-litre equivalent of another pack, and make a separate entry when you switch from mustard oil to another oil. A price change within the same product is easier to see when the variety and unit stay consistent.
How food inflation fits into the picture
The National Statistics Office reported 8.94% year-on-year food inflation in October 2026, up from 7.74% in September, in its 12 November release. That figure measures a broader basket of food and compares October with the same month a year earlier. The seven-item retail table here tracks a selection of groceries over one week. Each measure answers a different question about the cost of food. Read the October Consumer Price Index release.
How to make a useful weekly price check
Save the per-kilogram price of your regular rice, atta, dal and vegetables from the same market or retailer. Write down the date and variety beside each figure. Check the same items the next week, then multiply any change by the quantities your household buys. If you switch to a different pack size or variety, compare the unit prices and note that the product changed. If your rice lasts a month and you buy vegetables twice a week, use a full month of comparable purchases when checking what changed in your overall food budget. That gives you a consistent record against which you can read the next government price release. Open the Price Monitoring System.